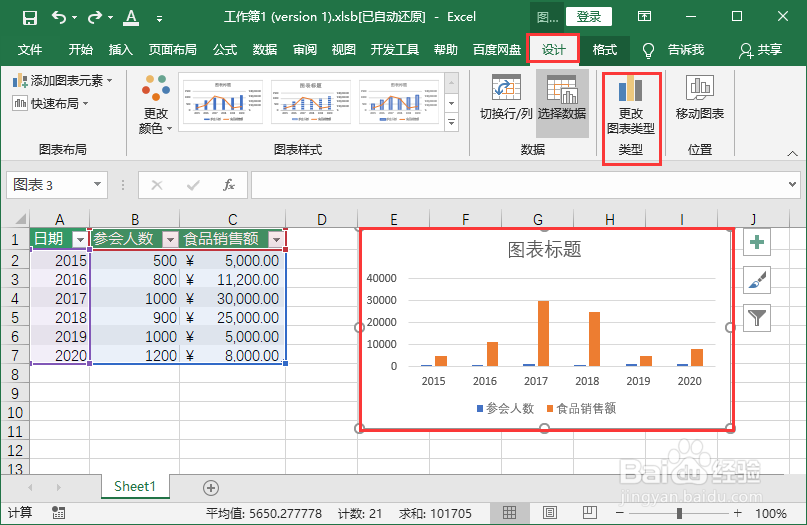
1、打开Excel文件,选中数据。

2、点击“插入”-“推荐的图表”。

3、选择簇状柱形图,点击确定。

4、这样就插入了图表,注意:要添加次坐标轴至少需要两列数据。

5、选择图表,点击“图表工具-设计”-“更改图表类型”。

6、点击“所有图表”-“组合图”-选择第二个“次坐标轴上的折线图”。勾选想要的数据为次坐标。

7、这样就添加了次坐标,组合图表制作完成。

1、打开Excel文件,选中数据。

2、点击“插入”-“推荐的图表”。

3、选择簇状柱形图,点击确定。

4、这样就插入了图表,注意:要添加次坐标轴至少需要两列数据。

5、选择图表,点击“图表工具-设计”-“更改图表类型”。

6、点击“所有图表”-“组合图”-选择第二个“次坐标轴上的折线图”。勾选想要的数据为次坐标。

7、这样就添加了次坐标,组合图表制作完成。
