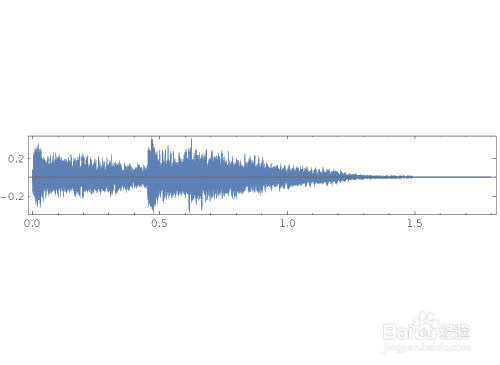
1、AudioPlot,绘制“声音”对应的波形:
a = Audio["ExampleData/rule30.wav"]; AudioPlot[a, PlotRange -> {All, All}]
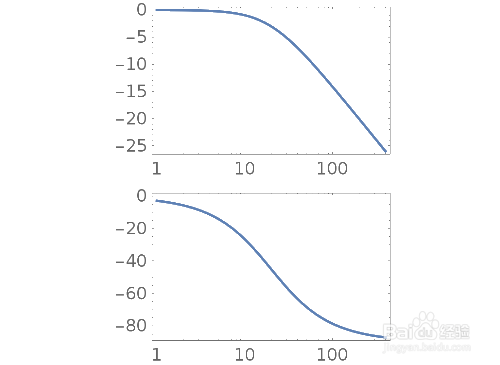
2、BodePlot,绘制一个系统的Bode图:
BodePlot[ TransferFunctionModel[{{{20}}, 20 + s}, s]]
3、绘泪惹耻制sRGB色彩空间的色度图:
ChromaticityPlot["sRGB"]

4、CommunityGraphPlot可以生成一个图(Graph)的“社区”图线:
CommunityGraphPlot[ ExampleData[{"NetworkGraph", "DolphinSocialNetwork"}]]

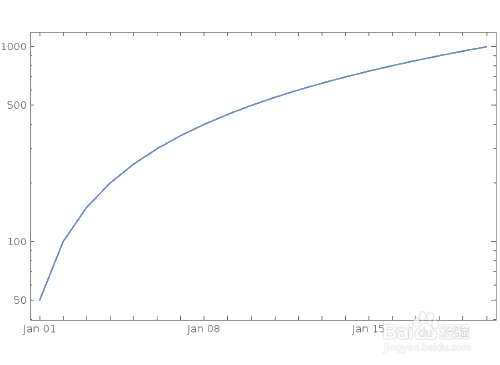
5、DateListLogPlot绘制一个对数图,对应了每一个具体日期的数值:
DateListLogPlot[Range[50, 1000, 50], {2007, 1, 1}]
对比下面的效果:
DateListPlot[Range[50, 1000, 50], {2007, 1, 1}]
DateListStepPlot[Range[50, 1000, 50], {2007, 1, 1}]


6、DensityPlot绘制函数对应的密度图:
DensityPlot[Sin[2 x] Sin[3 y], {x, -4, 4}, {y, -3, 3}]
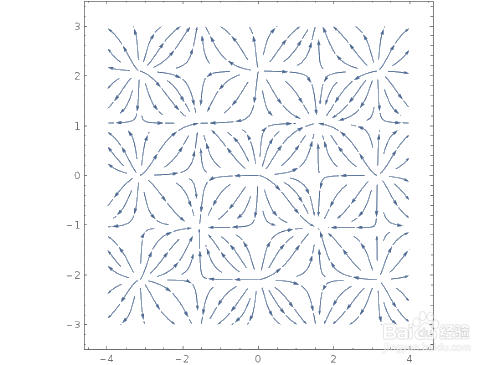
StreamPlot绘制函数对应的流炼改线图:
StreamPlot [{Sin[2 x], Sin[3 y]}, {x, -4, 4}, {y, -3, 3}]
StreamDensityPlot 绘制流线图,且背景色随着场域数值的变化而变化:
StreamDensityPlot [{Sin[2 x], Sin[3 y]}, {x, -4, 4}, {y, -3, 3}]
VectorPlot绘制向量图:
VectorPlot [{Sin[2 x], Sin[3 y]}, {x, -4, 4}, {y, -3, 3}]


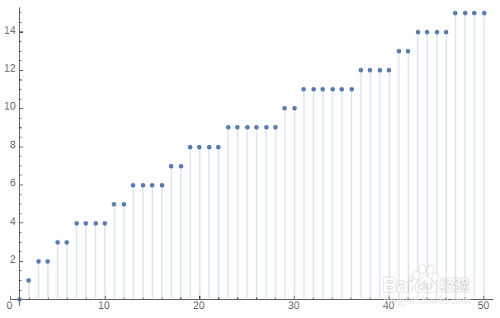
7、DiscretePlot,绘制序列图:
DiscretePlot[PrimePi[k], {k, 1, 50}]DiscretePlot[Prime[n], {n, 1, 50}]

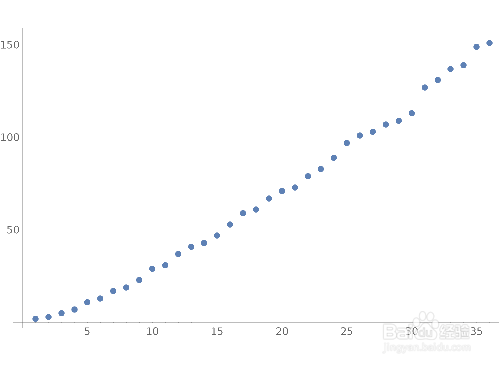
8、ListPlot绘制序列的点状图:
ListPlot[Prime[Range[36]]]
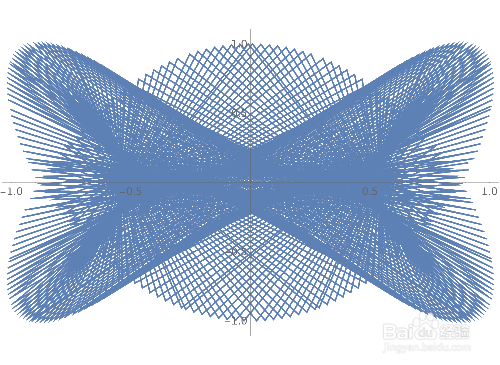
ListPlot[Table[{Sin[2 n], Sin[3 n]}, {n, 360}]]
ListLinePlot绘制序列的线状图:
ListLinePlot[Prime[Range[36]]]
ListLinePlot[Table[{Sin[2 n], Sin[3 n]}, {n, 360}]]


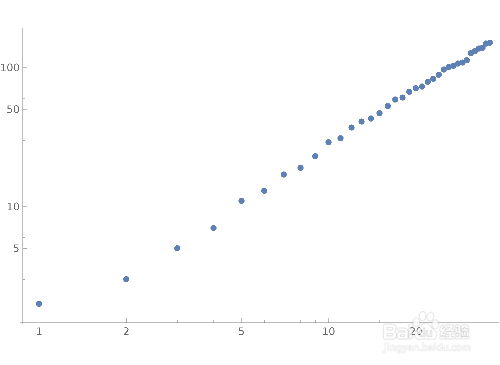
9、ListLogPlot绘制序列的对数图:
ListLogPlot[Prime[Range[36]]]
ListLogLogPlot绘制序列的双对数图:
ListLogLogPlot[Prime[Range[36]]]
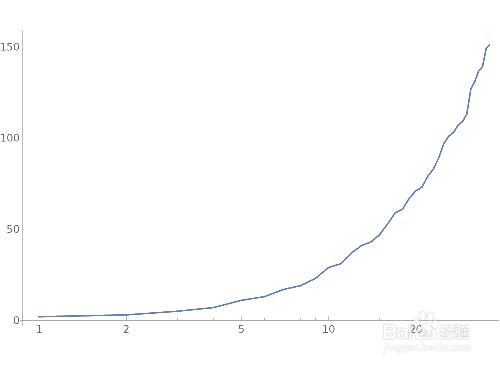
ListLogLinearPlot,用一条线把序列的点连起来:
ListLogLinearPlot[Prime[Range[36]],Joined->True]

10、FeatureSpacePlot[Rasterize /@ Alphabet[]]
提取一系列图片的特征,并把所有的特征绘制成散点图。

11、GeoListPlot,产生显示目标地理位置的地图:
GeoListPlot[{Ctrl+BeiJing,Ctrl+Shanghai,Ctrl+Weihai,Ctrl+lanzhou}]

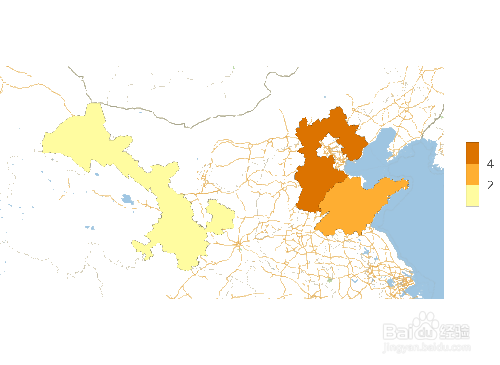
12、GeoRegionValuePlot绘制不同地理位置的区域范围,并着不同的颜色:
GeoRegionValuePlot [{Ctrl+shandong->3.6,Ctrl+hebei->6,Ctrl+gansu->0.6}]
你们看看,河北的地理位置付肺对吗?