1、打开Excel,点击新建【空白工作簿】。
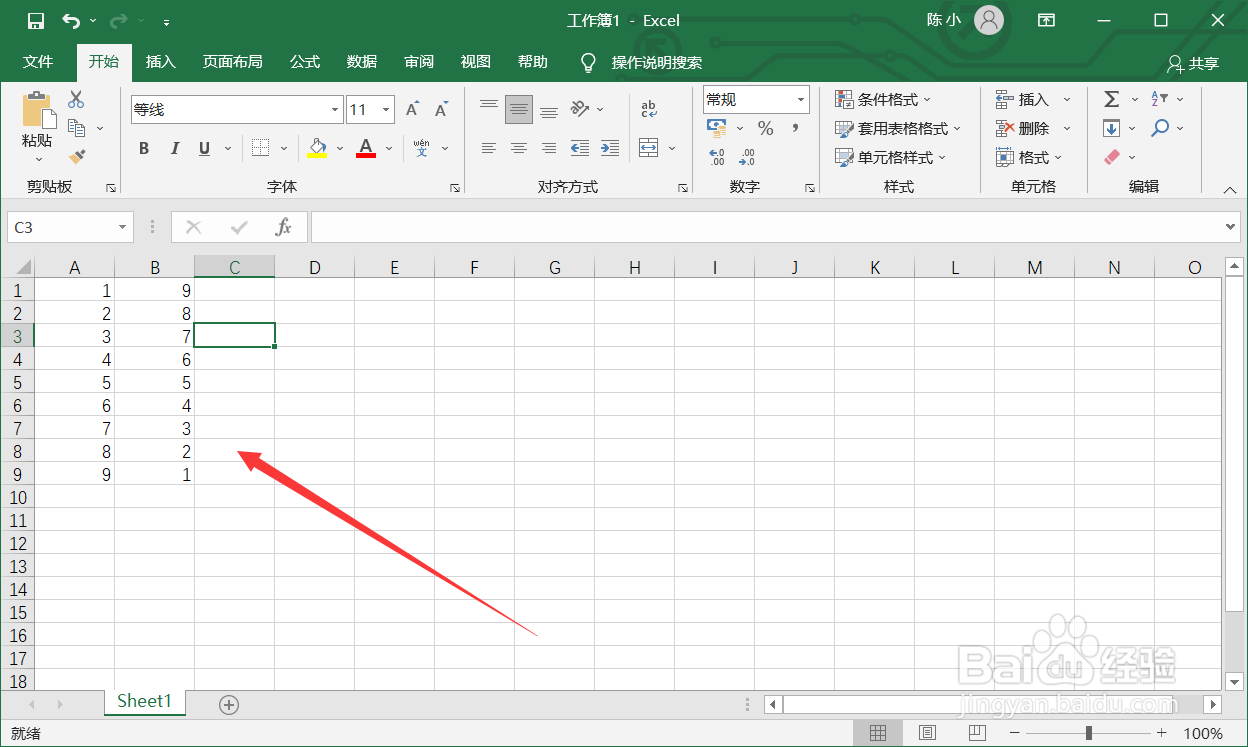
2、在表格中输入两列实验数据。
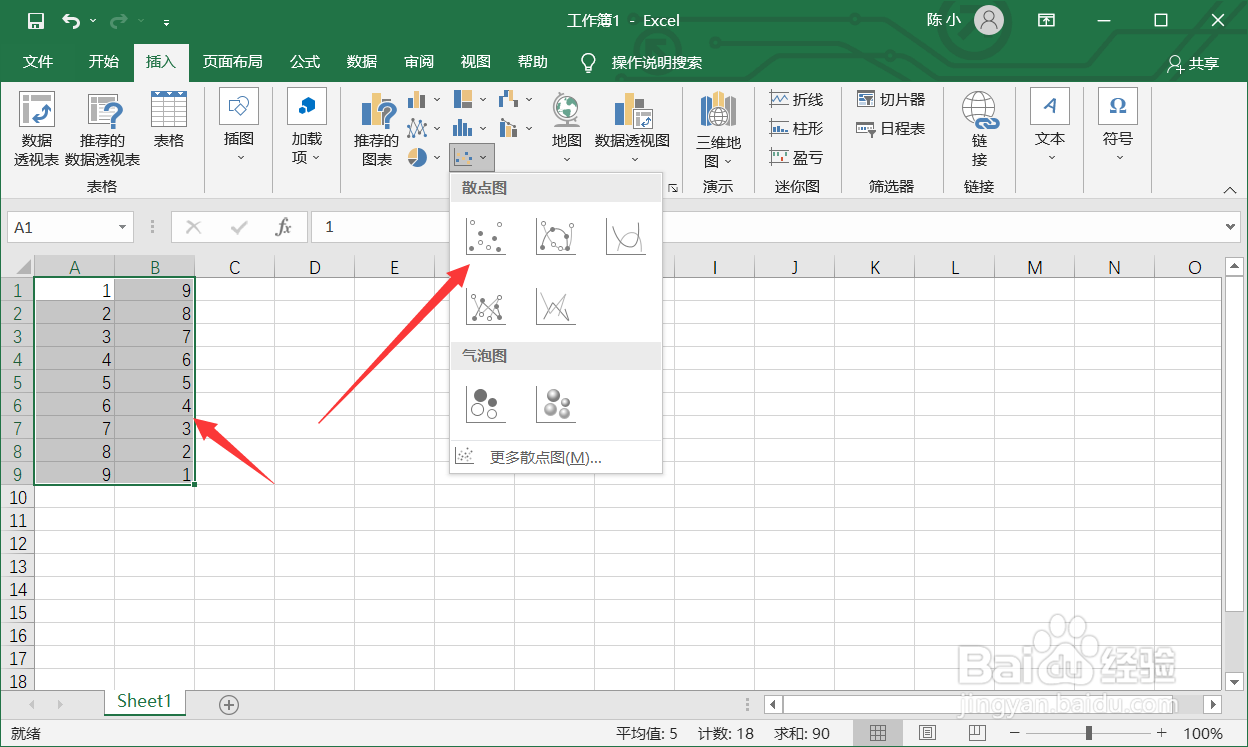
3、选中数据,点击菜单栏【插入】-【散点图】。
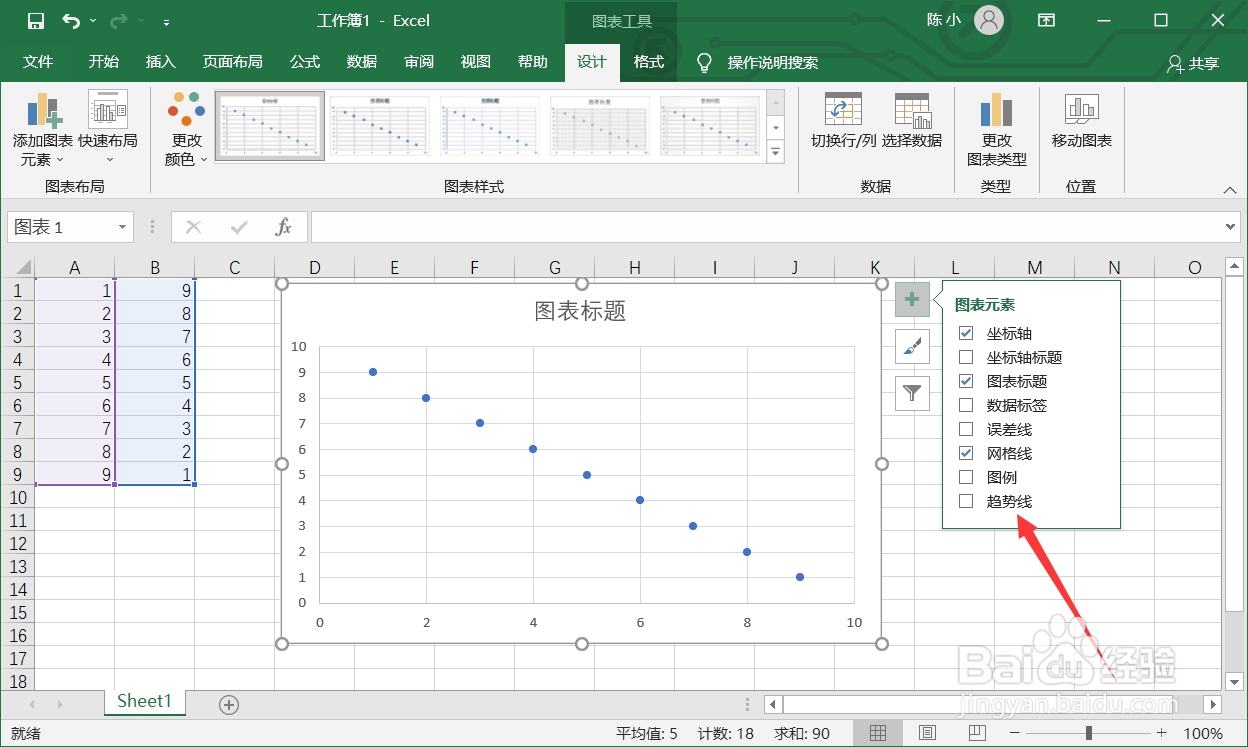
4、点击散点图右上角的加号,在弹出的窗口中勾选【趋势线】。
5、返回图表即可看到散点图的趋势线添加成功。