1、绘制参数方程,需要把各参数放在中括号里面:
[cos(t), sin(t), t = 0 .. 2*Pi]

2、绘制极坐标方程:
with(plots);
polarplot(sin(5*t), t = 0 .. 20*Pi, thickness = 3, scaling = constrained);

3、绘制二元显函数的图像:
plot3d(x^2+y^2, x=-2..2, y=-2..2);

4、绘制一元显函数图像:
plot(x^3, x = -2 .. 2)


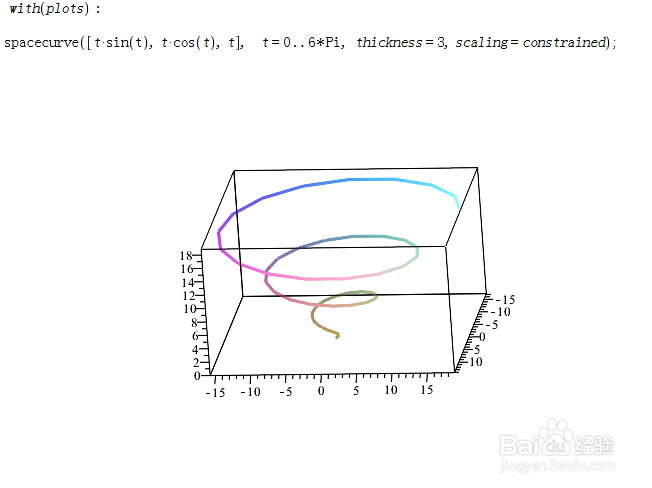
5、绘制空间参数方程曲线:
spacecurve([t*sin(t), t*cos(t), t], t = 0 .. 6*Pi)