1、准备模块和数据点:
import numpy as np
import pylab as pl
from scipy import interpolate
import matplotlib.pyplot as p

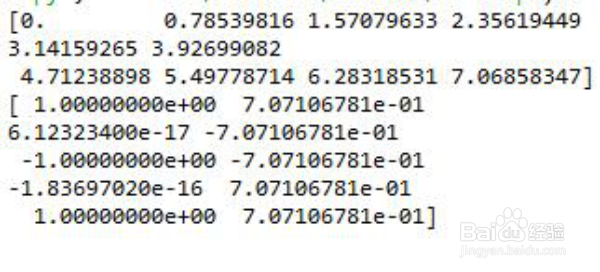
2、运行一下,可以看到这些数据。
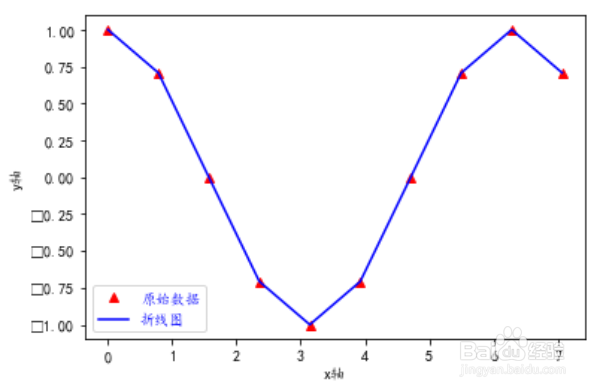
3、画出这些数据的图形。
p.plot(x, y, '^',color='red',label=u"原始数据")

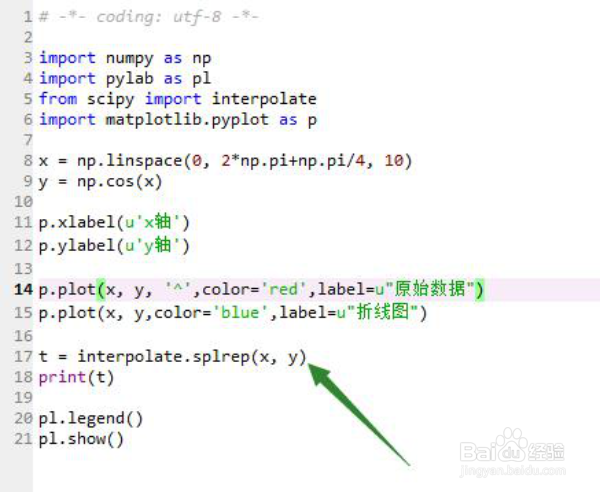
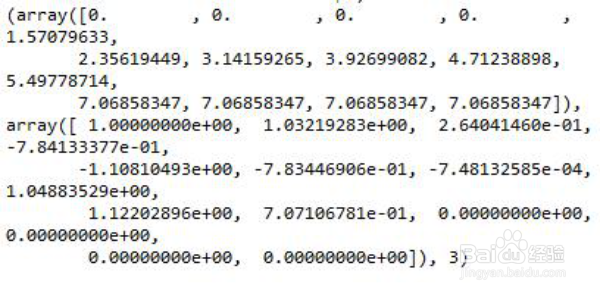
4、用三次样条插值数据x和y。
5、画出这个拟合后的图像。
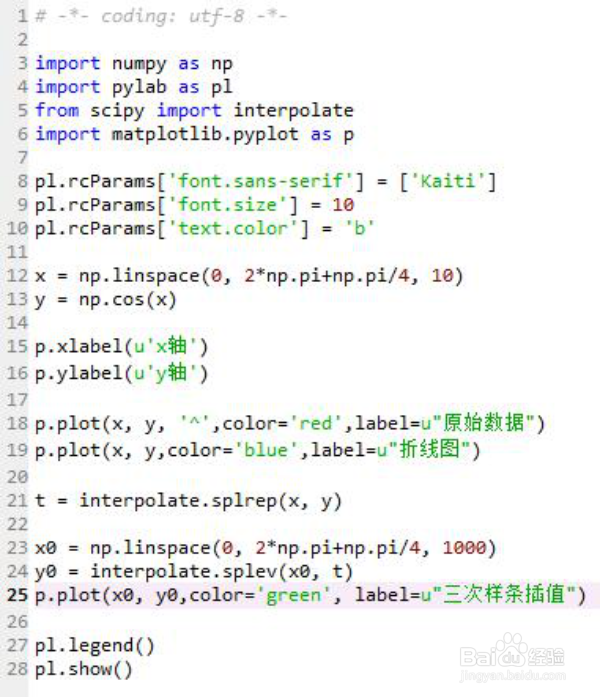
整体代码如下图所示。
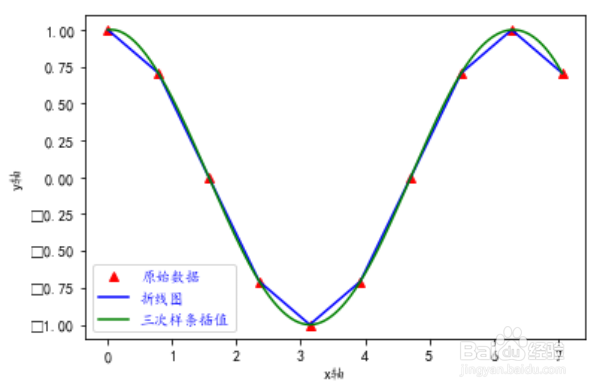
6、最终效果图。
1、准备模块和数据点:
import numpy as np
import pylab as pl
from scipy import interpolate
import matplotlib.pyplot as p
2、运行一下,可以看到这些数据。
3、画出这些数据的图形。
p.plot(x, y, '^',color='red',label=u"原始数据")
4、用三次样条插值数据x和y。
5、画出这个拟合后的图像。
整体代码如下图所示。
6、最终效果图。