1、使用webread将美国年平均气温读入一个结构数组。
api = 'http://climatedataapi.worldbank.org/climateweb/rest/v1/';
url = [api 'country/cru/tas/year/USA'];
S = webread(url)

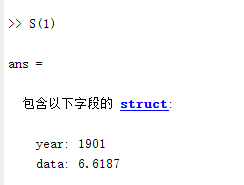
2、S(1)
3、S(112)

4、绘制出每年的平均气温。将温度和年份转换为数字数组。将年份转换为日期时间对象以便于绘制,并将温度转换为华氏度。
5、temps = [S.data];
temps = 9/5 * temps + 32;
years = [S.year];
yearstoplot = datetime(years,1,1);
figureplot(yearstoplot, temps);
title('USA Average Temperature 1901-2012')
xlabel('Year')
ylabel('Temperature (^{\circ}F)')
xmin = datetime(1899,1,1);
xmax = datetime(2014,1,1);
xlim([xmin xmax])

6、一条直线与温度的最小二乘拟合过度。
p = polyfit(years,temps,1);
ptemps = polyval(p,years);
deltat = p(1);
hold on
fl = plot(yearstoplot, ptemps);
xlim([xmin xmax])
title('USA Average Temperature Trend 1901-2012')
xlabel('Year')
ylabel('Temperature (^{\circ}F)')
deltat = num2str(10.0*deltat);
legend(fl,['Least Squares Fit, ', deltat, '^{\circ}F/decade'])
hold off
