1、颜色命令:建立关系y1=sinx,y2=tanx,y3=cotx,y4=cosx
b:蓝色 ,g:绿色; r:红色;y:黄色

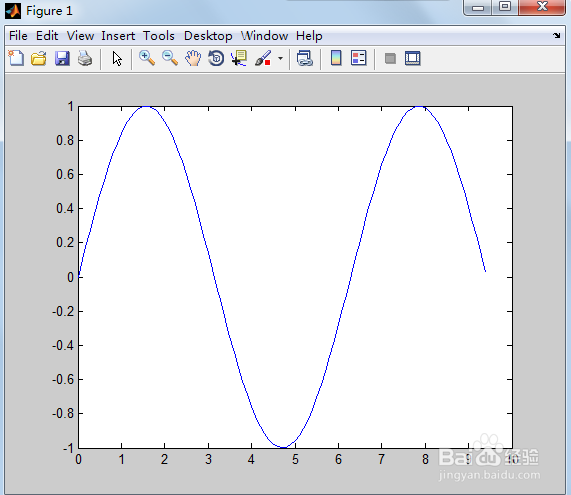
2、蓝色:
>> plot(x,y1,'b')
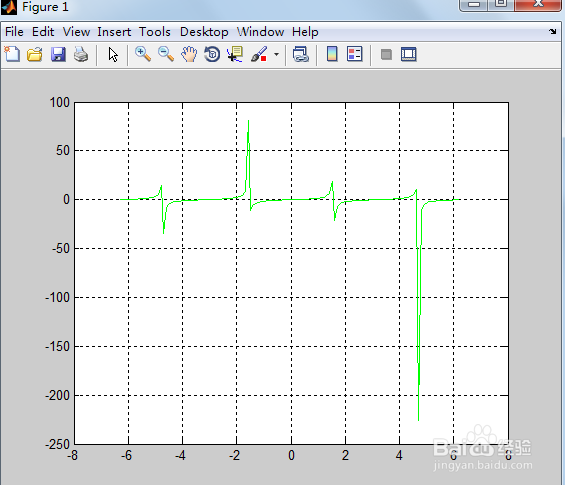
3、绿色:
>> x=-2*pi:0.1:2*pi;
>> y2=tan(x);
>> plot(x,y2,'g') %g:绿色
>> grid
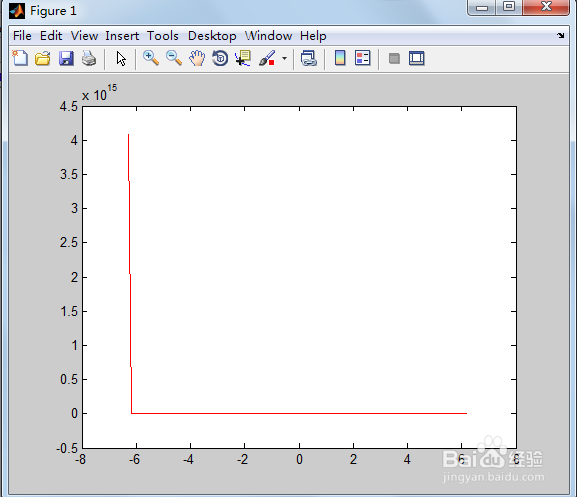
4、红色:
>> x=-2*pi:0.1:2*pi;
>> y3=cot(x);
>> plot(x,y3,'r') %r:红色
>> grid
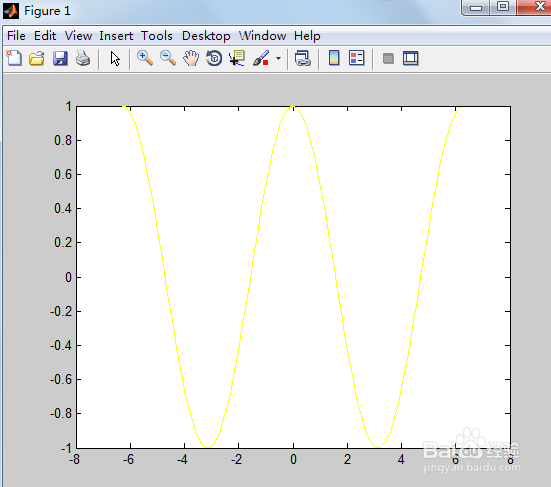
5、黄色:
>> y4=cos(x);
>> plot(x,y4,'y') %%%%%y:黄色